Product Design
How might we help drivers to analyze their daily routines?
A smart traveling data recorder with an interactive companion app to control and display the collected data on car speed monitoring.

Role Product Designer
Duration Nov 09 - Nov 30, 2017 (3 weeks)
Tools Sketch, Illustrator, Photoshop
Category UX/UI Design
Generating the concept
How idea is formed
The problem is many car accidents happen due to drivers lack awareness of their driving habits, not familiar with bad habits which are extremely dangerous when driving at high speed. A car traveling data recorder is extremely important when there is no witness. The function of traffic recorder is to record various images and record the track of the vehicle. When accidents occur, the image saved by the car recorder will be the most powerful and direct evidence. In particular, major traffic accidents also provides evidence for insurance companies to make claims more accurate and quick. It is also a kind of fun to keep track of everything in the journey. The idea of the smart device is to use traffic recorder to monitoring car movements and collect data while the traffic recorder recording daily scenery.
Identify the user
Drivers and their family members.
Service jobs: truck drivers, bus drivers, uber driver, etc.
Aggressive drivers: teenager, senior, road rage, speeding grandma, etc.
Keywords: Multifunctional, Wellness, Organizes, Data collection, Data visualization, Design, Aesthetic, Technological, Saves time, Connects, Community...
Designing the smart device
Based on the user research and personal driving experience, the smart travelling data recorder would look like a general full-screen GPS Navigator with an HD camera. The device will automatically record car speed and distance. The device will automatically turn on when the vehicle launched. The drive mode is activated automatically when the vehicle is in motion. The companion app will display data on the app and generate the trip report, the daily report and weekly report. Recorded videos are automatically synced to cloud storage and users can easily access from the companion app. The app also generates safety tips from each trip travelled.
Data Being Collected
Avg. Speed
Time travelled
Hard breaking event
Sudden acceleration event
Times of rushing through a yellow light
Avg. driving time
Time in a traffic jam
Recorded video from each trip
Designing the app
App Features
GPS Navigation
Driving report (data visualizations / driving, safety tips)
Online video storage / video sharing community
Profile / settings

Moodboard


User Flow

Wireframe

Mid-fidelity wireframes


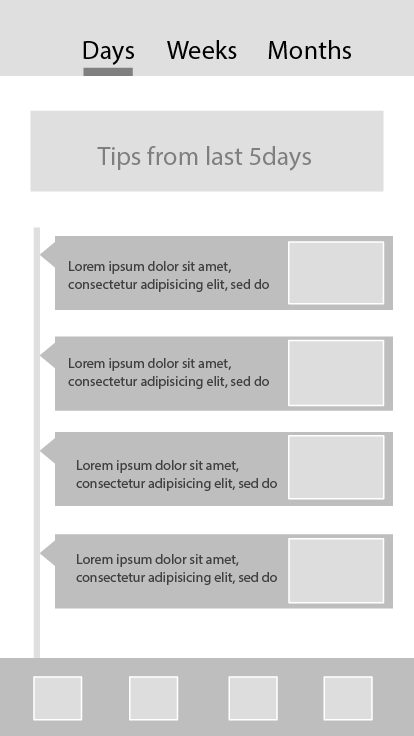
Data Visualization

This app is particular focused on data visualization, the squares are representing every completed trip. Height and color are representing the time spent in traffic. High-speed driving will increase the width of the square. The colored square shows overall time spent which could help user on time management.
Project Reflection
For this project, I would like to add more details on data visualization and user interface, also expand the project further on emotional value towards user. I felt the app is multifunctional but lack of fun and entertainment. The app could be improved if there is an interesting entertainment feature to ensure the app daily usage and motivate user in a positive way.